Every AWS Lambda log,
stitched into one story.
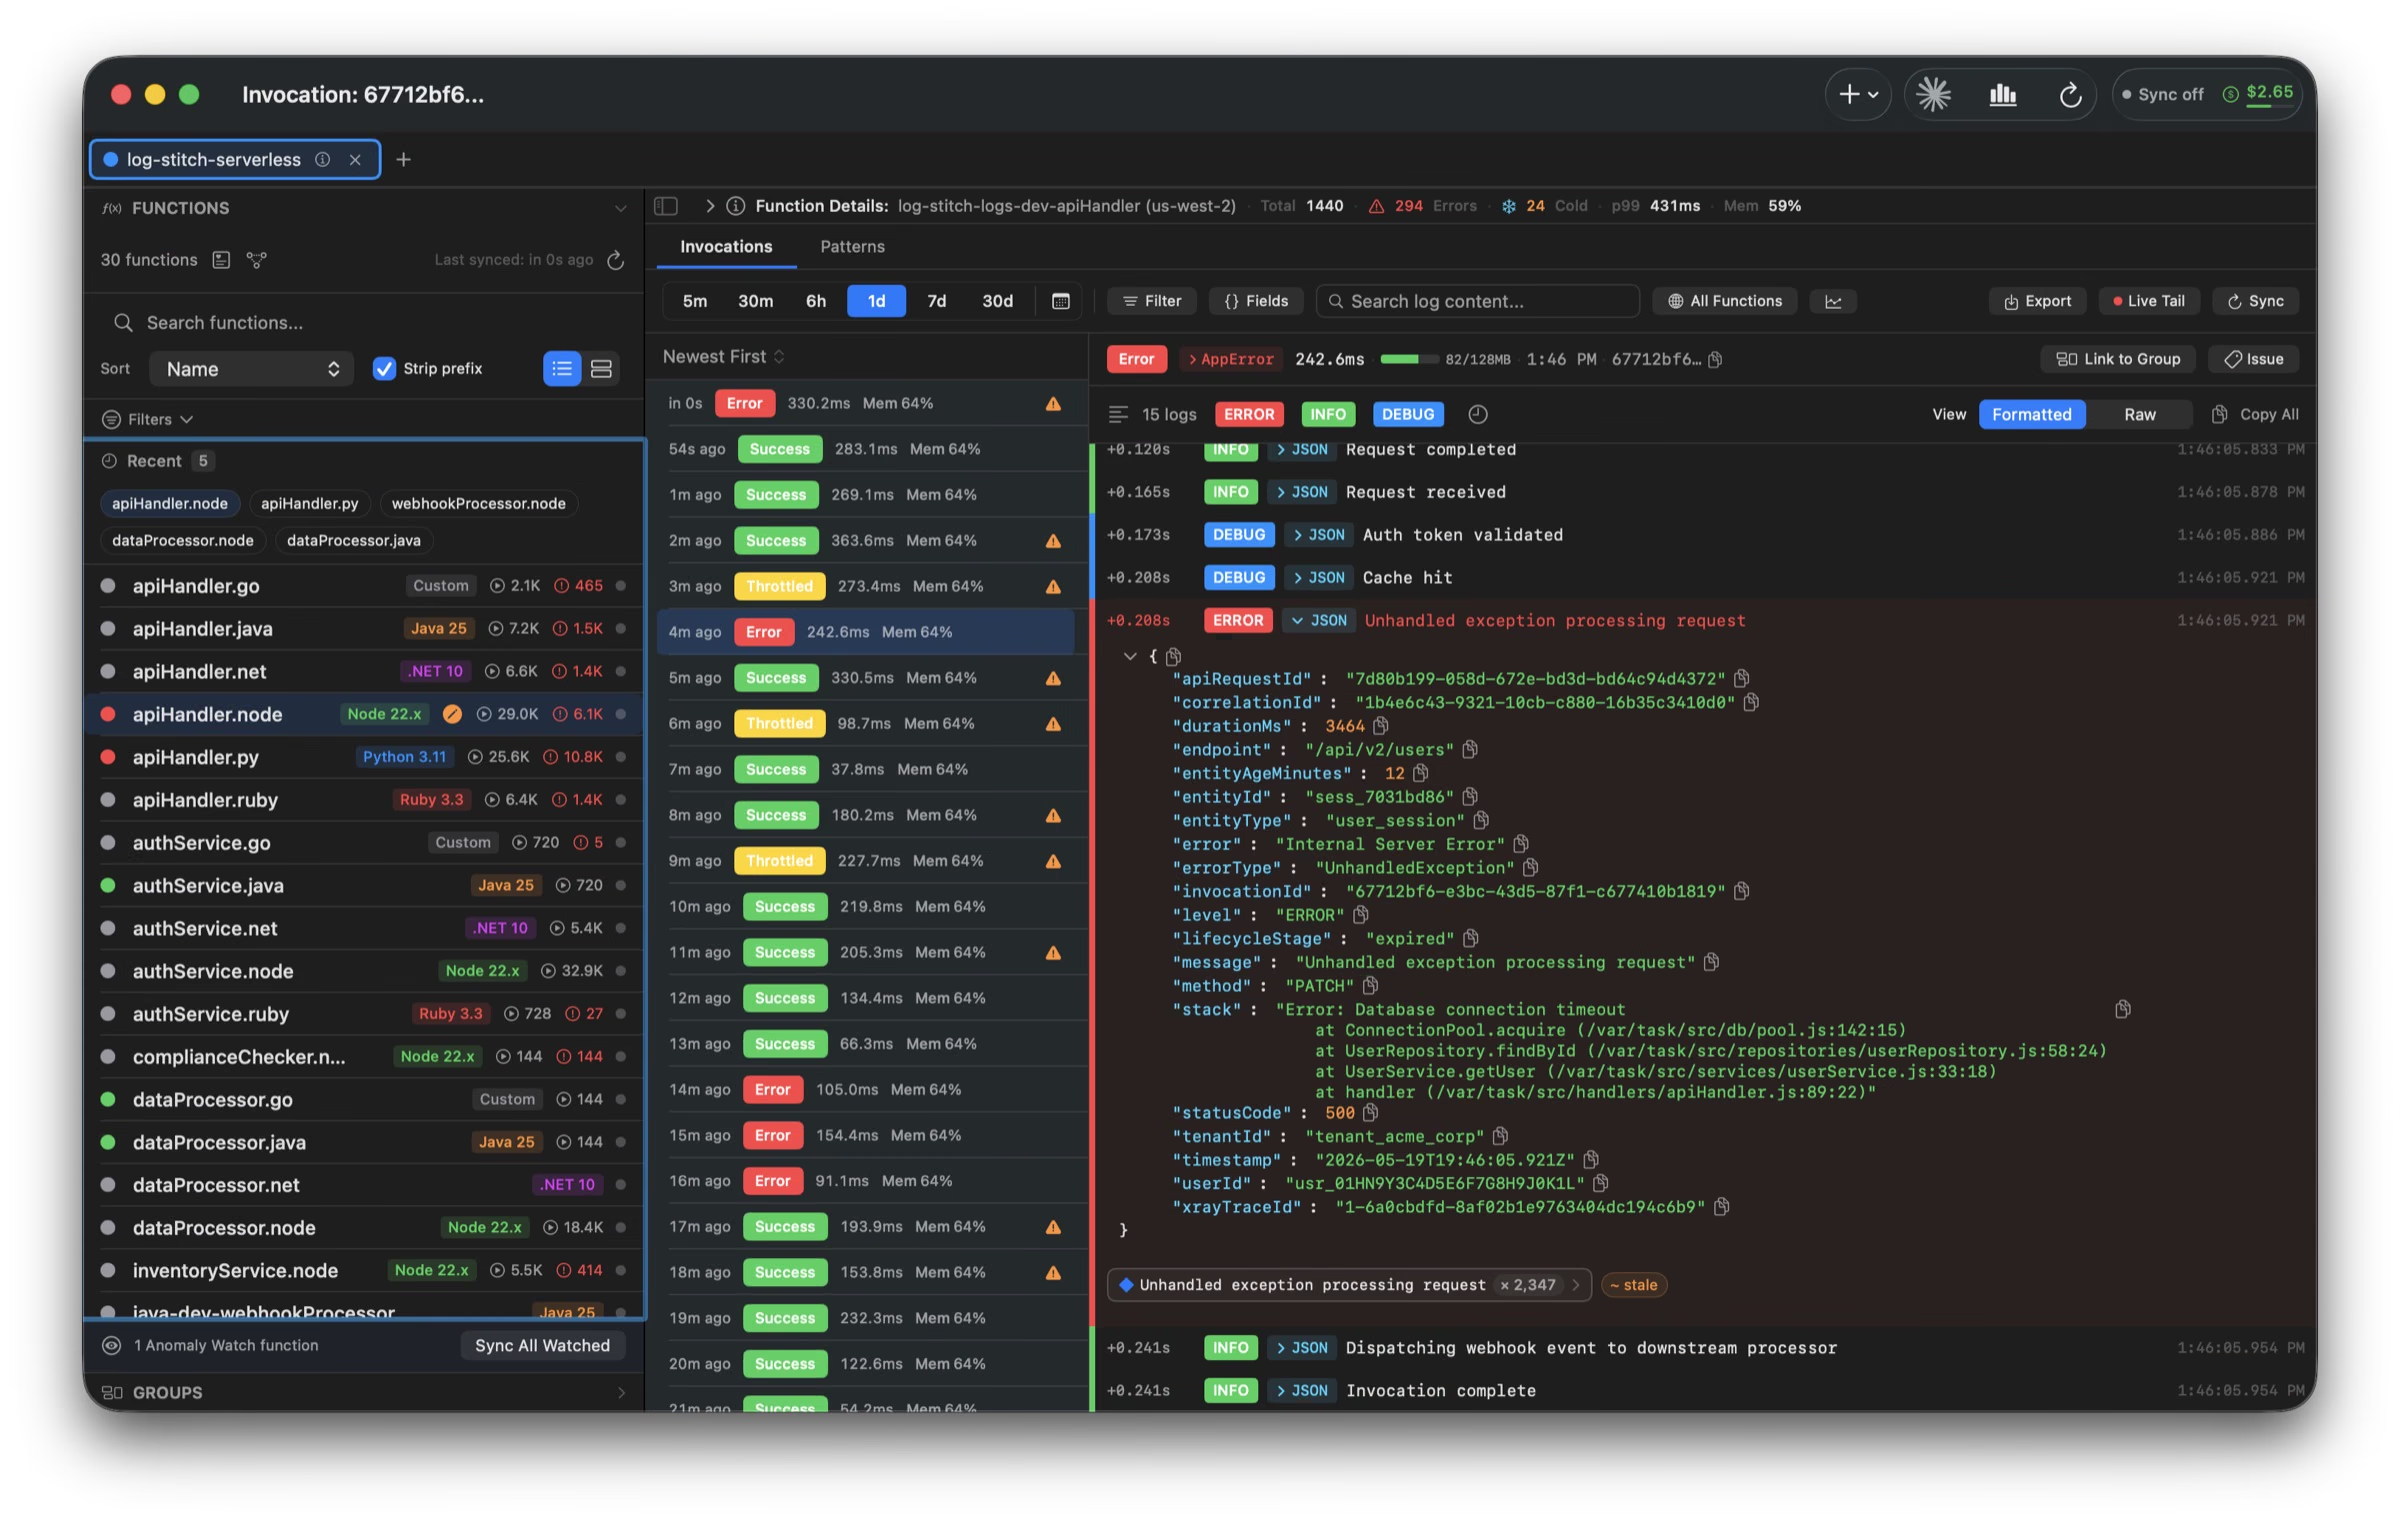
Stop scrolling CloudWatch line by line. LogStitch groups every log produced by a single request ID — across the functions it touched — into one coherent invocation you can actually read.
Raw CloudWatch streams are a mess.
AWS Lambda invocations are the story.
CloudWatch interleaves log lines from every concurrent execution into one timestamp-sorted river. LogStitch reads the request ID stamped on each line and weaves them back into the invocation they belong to — locally, in milliseconds.
CloudWatch Logs Before
Five concurrent invocations, one log group. Good luck.
LogStitch After
Same logs, regrouped by request ID. Each invocation becomes legible.
Four things, done obsessively well.
Stitch
Logs grouped by request ID, with platform events, JSON parsing and cold-start flags surfaced at a glance.
Correlate
Follow a request across the functions it touched with a swim-lane timeline and propagation latency.
Analyze
p99 trends, cold-start scatter, memory right-sizing, cost projection — built in, no separate dashboards.
Detect
Error patterns auto-clustered. Statistical anomalies on duration, errors, cold starts and cost surface themselves.
From AWS profile picker to root cause in three clicks.
A function list that actually scales.
1,000+ Lambdas load from local cache in under 200ms. Pin what matters, alias long ARNs, filter by runtime, region or health. Background sync keeps each function's invocation history fresh without you asking.
- Health badges — color and label, never color alone
- Per-function sync interval and retention windows
- Config-change indicators when memory, timeout or runtime drift
- Auto-detected dependency graph across functions
The whole request, one swim-lane.
Search by request ID or correlation header to surface every invocation a single user action touched as it passed through your functions. Propagation latency between hops, the function that originated the error, and the downstream blast radius are all on one screen.
- Temporal-proximity correlation when correlation IDs are missing
- Sparse-chain detection flags missing intermediate hops
- Interleaved log stream with platform-event dividers
- Bookmark a correlation group and come back to it
Real-time, without losing structure.
Open a 15-minute live-tail window on any function. Stream mode shows raw lines as they land; Invocations mode finalises them into the same stitched cards you get from the database. Completed invocations are saved automatically — your live session leaves a permanent trail.
- Auto-scroll pauses on manual scroll-up
- Live event-rate, error and cold-start counters
- Client-side text filter without stopping the stream
- One-click extension when the session expires
Lambda performance and cost,
in the same window as your logs.
Duration trends, cold-start distributions, memory right-sizing and a working monthly cost projection — all calculated from the data already on your disk.
The thing that's broken
finds you first.
Recurring errors are clustered into patterns with lifecycle states. Statistical outliers across duration, errors, cold starts and cost surface themselves before customers do.
Error patterns
Log lines with the same message template — even with different request IDs, user IDs and timestamps — collapse into one pattern with a lifecycle, a sparkline and an impact score.
Anomalies
Z-score scoring across duration, error rate, cold-start frequency and cost. Critical (≥3σ) and warning (≥2σ) deviations get badged and grouped. Resolution and auto-dismissal are tracked.
Hand Claude the keys to your CloudWatch — without exposing your account.
LogStitch ships a local Model Context Protocol server, bound to 127.0.0.1 only and never exposed to the network. Point Claude Code at it (or any other MCP-aware tool that can reach a local port) and your assistant can search logs, drill into invocations, run statistical analysis and pull cost projections — all against the local SQLite database. Your AWS credentials never leave the Keychain.
Unhandled exception · 500 · userId={userId} — went from 4% to 18% of invocations, and a deploy at 13:38 reset the runtime cache, causing 24 cold starts (init avg 1.8s) inside a 9-minute window. The error pattern is already linked to JIRA-2841.
The boring details
done right.
AWS profiles
01- Imports ~/.aws/config and credentials
- Static keys, SSO (OIDC device flow), Assume Role chains
- Credentials validated via STS before save
- Color-coded workspace tabs; ⌘⇧P profile switcher
- Live session countdown with one-click refresh
Log search
02- SQLite FTS5 full-text over every cached line
- Field-aware filters with auto-complete on discovered keys
- Global cross-function search, grouped by invocation
- Pin JSON fields as columns in the invocation list
- Save and re-run filter presets
Background sync
03- Per-function intervals; only fetches new data since last cursor
- Daily CloudWatch API cost budget with auto-pause
- Exponential backoff on throttling
- Catch-up detector deprioritises expensive backfills
- Sync queue dashboard with per-function health
Issue tracking
04- Jira Cloud (OAuth 2.0) and GitHub OAuth / App connections
- Create or link issues with full invocation context
- Configurable templates with variable placeholders
- Pattern-level linking with status discrepancy detection
- Live issue status polling on the invocation
Export
05- JSON, CSV, plain text — pick which fields and whether to include log lines
- Size-limit warnings before writing
- Determinate progress for large exports
- Standard NSSavePanel integration
Storage
06- Local SQLite with versioned, forward-only migrations
- Online-backup snapshots; 30-day backup reminder
- Configurable retention windows; auto-cleanup service
- Per-table storage stats and pattern cache eviction
Your logs never leave your machine.
No LogStitch backend. No third-party analytics on log content. No telemetry that includes your data. The app talks to AWS, your local SQLite database, and any issue tracker you've explicitly connected — nothing else.
Stop reading log lines.
Read invocations.
A one-time purchase — buy direct or on the Mac App Store, same price either way. Free 14-day trial — no card, no account, no telemetry.
- For personal & non-commercial projects
- Unlimited AWS profiles & Lambda functions
- All analytics & pattern detection
- Issue-tracker connections (Jira, GitHub)
- Local MCP server for Claude & AI tools
- For commercial use at work
- Unlimited AWS profiles & Lambda functions
- All analytics & pattern detection
- Issue-tracker connections (Jira, GitHub)
- Local MCP server for Claude & AI tools
Try every feature free for 14 days — no card, no account.
By purchasing a direct license you agree to the License Agreement and Privacy Policy. Direct sales are handled by Lemon Squeezy.